April 16, 2011
Project reports, the next generation
Your project at a glance—that’s what a convincing project report should be all about. Three years ago, we designed the now-former version of the project reports in mite. Thanks to your feedback, we’ve learned a great deal about which information is really relevant for a project. So much, that we decided to go back to start. And redesign the project reports from scratch.
Today, we’re extremely happy to lift the curtain, finally: here they are, meet your brand spanking new project reports!
Slimmed-down project header
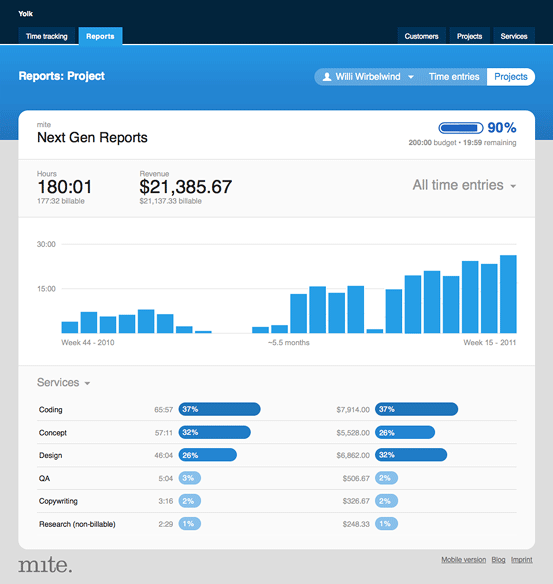
We reduced the info shown in the header area rigorously. There are only a few key figures that are always worth your attention: the total hours, the total revenue plus the budget if there is one. Thus, the new project reports feature only those figures in the project header—period. Focus is what counts.
Activity graph
Below, the new project reports display an activity graph, a timeline of your project. The resolution of the bar chart adapts to the total duration of the project: each bar represents either a month, a calendar week or a day.
Hours & revenue per service or team member
The third area of the project report breaks down hours and revenue per service. mite shows the total for each service and its percentage. The color code should make it easy to spot A, B and C services at first glance, from an hourly perspective as well as a financial one.
You can switch this section from »Services« to »Team« to analyze hours and revenue per team member.
All time entries / unlocked / locked
On every project report, you might choose if all time entries should be analyzed, or unlocked ones only, or locked ones only. All areas of the report will adapt accordingly: the key figures in the header, the bar chart as well as the service / team section.
Removed: list of all single time entries
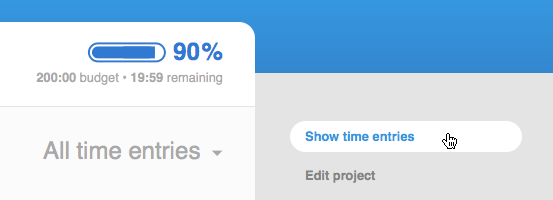
On the new project reports themselves, you won’t find a list of all single time entries any more. Instead, click on the total hours, on the total revenue or on the new button »Show time entries« in the sidebar to navigate to the tab »Reports => Time entries« which will be pre-filtered by project then.
In our opinion, this reduces complexity—which is always a good thing. Under the tab »Report => Time entries«, mighty tools to analyze and export time entries are available already. We’re convinced that an easily accessible link to this tab is far better than to dublicate all of those features on every single project report. Two, this change speeds things up a great deal: even big projects with several hundreds or thousands time entries now load in a snap.
Shared reports
The new project reports can still be shared; we redesigned those shared reports accordingly. There’s one new setting though: you can choose whether or not you’d like to include all single time entries on the shared report. If you activate this option, a slimmed-down version of »Reports => Time entries« will be displayed. Thus, you’re customer can filter, group, and sort the time entries of this report by himself. Also, he can export those time entries to Excel or as a .CSV file.
This setting is disabled by default. On those reports that were shared already, we disabled it, too. Please enable it yourself if you’d like to grant your customer this little extra transparency.
Some tech-stuff on the new charts
On the new project reports, we got rid of the old Flash charts. Thus, all charts can be viewed without a special browser plugin, and printed without a hassle. As a bonus point, we had another look at printing in general and improved this part of mite, too.
Feedback?
We do hope you find the new project reports useful! Please tell us if you stumble upon any bugs or if you have any feedback on how they’re working out for you. We’d love to hear your thoughts. Thanks!
Julia in New features
Got something to add?